RU
Archived project2021

R · Shiny · Plotly

COVID-19 Dashboard

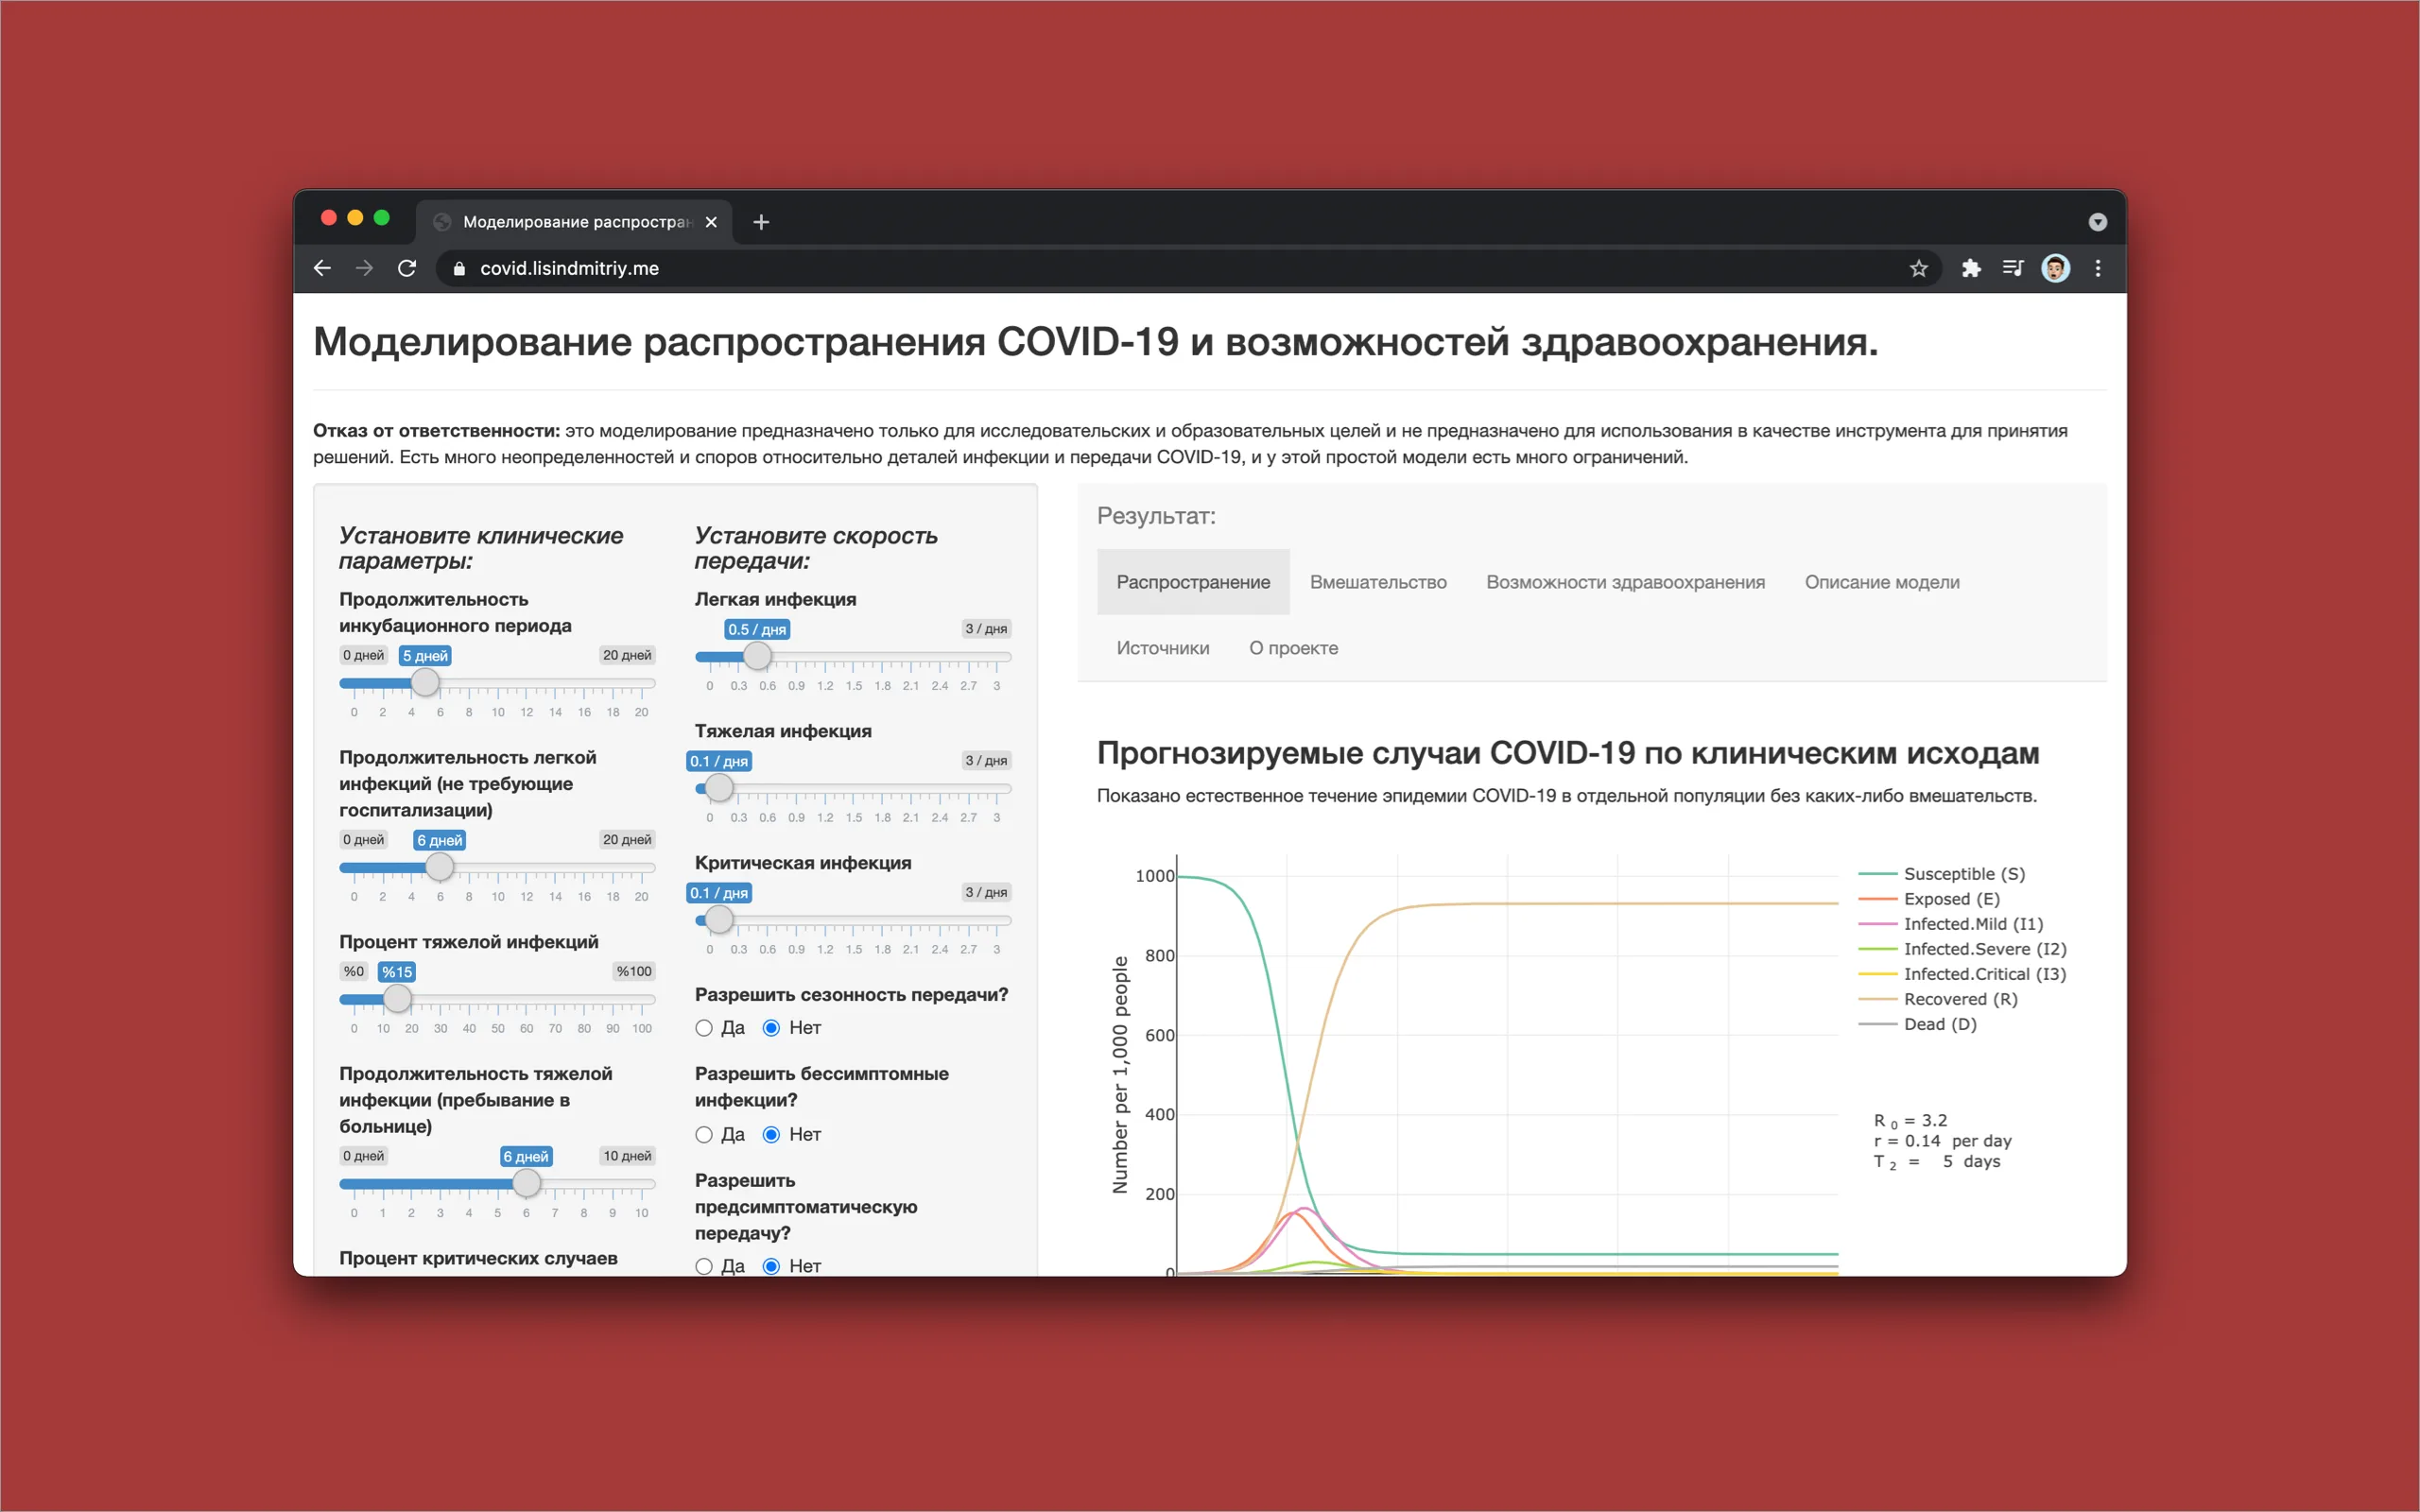
An interactive dashboard for modeling COVID-19 spread, intervention effects, and healthcare-resource capacity.

COVID-19 Dashboard interface

01

Epidemic and capacity modeling.

The project was developed as part of a dissertation on an information system for modeling and forecasting viral diseases. Its Shiny interface exposes clinical and transmission parameters, seasonality, asymptomatic and presymptomatic transmission, while Plotly renders the resulting simulations as interactive charts.

02

Period

2021
03

Format

Web dashboard
04

Stack

R · Shiny · Plotly

Archived project

Capabilities.

Core simulation workflows implemented in the dashboard.

01

Spread

Model susceptible, infected, recovered, and deceased populations with configurable clinical parameters.

02

Interventions

Configure intervention timing and strength with separate transmission reductions for different infection stages.

03

Healthcare capacity

Compare projected severe and critical cases against hospital beds, ICU capacity, and mechanical ventilation.

04

Model parameters

Incubation, disease severity, mortality, seasonality, asymptomatic, and presymptomatic transmission controls.

Archived project

Project completed.

COVID-19 Dashboard is no longer maintained as a public service. The model source, Shiny interface, documentation, and project materials remain available on GitHub.